Decoding weather fax on shortwave takes about an hour the first time and five minutes after that. You need a receiver that hears upper sideband, a way to get that audio into a computer, and decoder software that turns FM audio tones back into a black-and-white chart. No licence is required, and you do not need to transmit anything.
A weather fax, also called WEFAX, HF-FAX or Radiofax, is an analog slow-scan facsimile broadcast. A weather chart is sent line by line over high-frequency radio in upper sideband, with brightness carried as audio tones between roughly 1500 Hz (black) and 2300 Hz (white). Decoder software locks onto the phasing lines and rebuilds the picture on screen.
Short answer to the question everyone asks first: yes, it is still used. NOAA and the National Weather Service, the Deutscher Wetterdienst in Germany and the Japan Meteorological Agency all still transmit scheduled marine weather charts on HF, and sailors use them offshore where cellular data and satellite internet are expensive or unreliable. HF-FAX is one of the few ways to pull an official forecast out of the air with no internet connection at all. Plenty of other shortwave content survives too — marine RTTY, NAVTEX on MF, time signals and utility HF traffic.
Table of Contents
- 1What You Need
- 2Step-by-Step: Decode Weather Fax on Shortwave
- 31. Find a Shortwave Weather Fax Station and Schedule
- 42. Set Up the Receiver and Audio Path
- 53. Tune the Carrier and Start the Transmission
- 64. Tune the Picture and Speed
- 75. Save and Label the Weather Chart
- 86. Read the Weather Chart
- 9Common Mistakes
- 10Frequently Asked Questions
- 11Do I need a ham radio license to receive weather fax?
- 12Why do I tune 1.9 kHz lower than the listed frequency?
- 13Why is my decoded weather fax image slanted?
- 14Is the weather fax still used?
- 15Can I decode weather fax on an iPhone or Android without a computer?
- 16How do I know whether a decoded chart is actually usable?
- 17Conclusion
What You Need
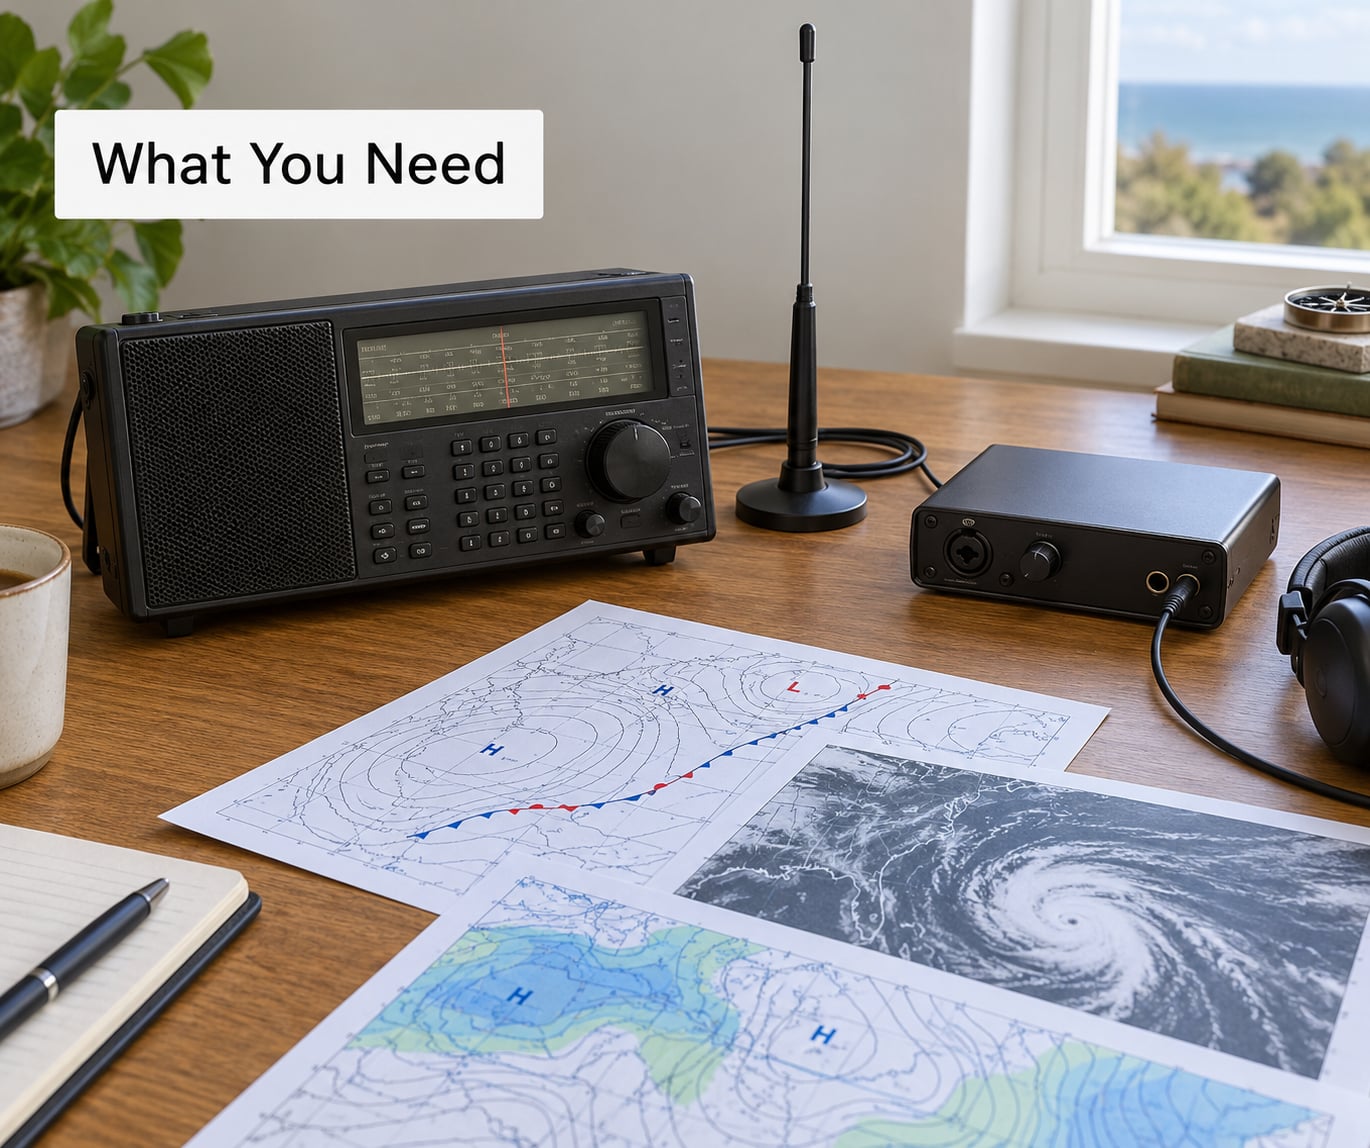
Four things, and only one of them is expensive.
A receiver that covers HF and does upper sideband. Any modern communications receiver does this, including many cheap portable sets. If you already own one, you are done. Decoders also work with SDRs, which means a low-cost RTL-SDR dongle paired with an HF upconverter, or a dedicated HF SDR, works fine. The dongle needs an upconverter because RTL-SDR hardware does not reach the HF bands on its own.
An antenna that suits your noise environment. Out in the country, a simple longwire or dipole is plenty. In town, local noise is usually the bigger problem than signal strength, and an active loop antenna that rejects common-mode interference does a better job than a bigger dipole. Keep the feedline away from mains wiring and power supplies.
An audio path from the radio to the computer. Three options, in order of preference. A 3.5 mm cable from the receiver’s line out to a USB audio interface gives the cleanest signal. A virtual audio cable — VB-Audio Virtual Cable and similar tools — loops the radio’s output back into the machine with no physical cable into the decoder. Speaker pickup with the mic sitting next to the speaker works in a pinch and picks up room noise with it.
Decoder software. FLdigi is free, runs on Windows, Linux and macOS, and handles WEFAX out of the box. MultiPSK is free and does weather fax along with lots of other modes. Black Cat HF Weather Fax and JVComm32 are polished commercial decoders aimed at mariners. SeaTTY was built for amateur radio digital modes including WEFAX and is worth trying if FLdigi feels cluttered.
You also want a chart reference, either the printed pilot chart handbook or the National Weather Service’s online documentation, so you can tell a surface analysis from a sea-state chart once the picture appears.
Step-by-Step: Decode Weather Fax on Shortwave
1. Find a Shortwave Weather Fax Station and Schedule
Most weather fax stations broadcast on a fixed schedule rather than continuously, so you are aiming at a window of time rather than tuning whenever you like. The table below lists stations that are widely heard in North America and Europe, with the frequency to actually dial. Frequencies change when stations get new equipment, so treat this as a starting point and confirm against the current schedule.
| Station | Carrier | Dial this in USB | Typical content |
|---|---|---|---|
| NMF / NBM Boston, USA | 6339 kHz | 6337.1 kHz | Ice charts and coastal forecasts |
| DWD Pinneberg, Germany | 13882.5 kHz | 13881.0 kHz | Surface analysis, sea temperature |
| DWD Hamburg, Germany | 3855 kHz | 3853.5 kHz | North Sea and Baltic charts |
| DWD Hamburg, Germany | 7880 kHz | 7878.5 kHz | Longer schedule, good daytime path |
| NMC Point Reyes, USA | 12786 kHz | 12784.1 kHz | Pacific surface analysis and satellite imagery |
| NMG New Orleans, USA | 17146 kHz | 17144.1 kHz | Gulf of Mexico and Caribbean charts |
| JMH Tokyo, Japan | 13090 kHz | 13088.1 kHz | Western Pacific surface charts |
Schedules live with the broadcasters. NOAA and the National Weather Service publish the worldwide marine radiofacsimile broadcast schedules on weather.gov/marine, and the Deutscher Wetterdienst and Japan Meteorological Agency publish their own equivalents. Check the times in UTC and convert, because a schedule printed in local time has caught out everyone at some point.
You will recognise a weather fax broadcast before you decode it. It sounds like a repeating warble that sweeps slowly up and down in pitch, with brief pauses between charts. That rising and falling tone is the picture being drawn. Speech, music and numbers stations look nothing like it, so you can browse the band on any receiver and spot a candidate without any software running.
2. Set Up the Receiver and Audio Path
Connect the receiver audio output to the computer, set the receiver to upper sideband, and turn automatic gain control and any noise compression or speech processing off. AGC squashes the level changes that the decoder reads as black and white, so a chart decoded with AGC on comes out flat and grey. Feed the audio in until the decoder’s level meter sits well below the red, then back it off a little. Overloading the input produces hard black smears that no amount of contrast control will fix.
If you are using an SDR with a virtual audio cable, open the audio device manager, pick the cable as the SDR’s output and as the decoder’s input, and set the sample rate to something the cable supports cleanly, such as 44100 Hz. With a physical cable, select the USB interface’s input in the decoder’s audio settings. Close anything else that might grab the device, including voice recording apps and conference software.
In the decoder, open the audio configuration and confirm the waveform display is moving before you tune anything. A flat line means the decoder is not receiving audio, and that is worth fixing now rather than after ten minutes of tuning.
3. Tune the Carrier and Start the Transmission
Here is the part that confuses nearly everyone. You tune 1.9 kHz below the published carrier. A station listed at 12786 kHz wants you to dial 12784.1 kHz in USB. The reason is that the picture tones occupy 1500 Hz to 2300 Hz of audio, so the radio’s receive filter has to be centred on that audio rather than on the carrier. Aim low and let the tones land in the middle of the passband.
Switch off automatic frequency control before fine tuning. With AFC on, the decoder keeps nudging the radio back to a frequency you already moved off, which feels like a broken dial.
Start the decoder in WEFAX IOC-576 mode. IOC 576 means the receiver scans at 576 lines, the standard for weather fax, and 120 lines per minute is the drum speed that goes with it. When the broadcast begins, the decoder hears the start signal and the phasing lines and locks onto them on its own. That auto-alignment is the part that takes the work out of weather fax; you are not manually synchronising anything line by line.
You know it worked when the tuning pane shows two clean parallel bands in different colours and the received image pane starts filling in with lines. If the pane is a solid block or the image is a set of diagonal stripes, the tuning is off.
4. Tune the Picture and Speed
Slant is the most common first-decode complaint, so expect it. The image arrives as a clean rectangle and then slowly shears sideways until it forms a parallelogram. The slant control in the decoder corrects this live: use the up and down arrows on the slant indicator until the lines stack evenly and the image turns into a straight rectangle. Faster decoders expose a line length or IQ control next to it, and the same arrows often adjust it.
If the picture is upside down or the text runs sideways, rotate it 90 degrees in the image viewer. On MacOS the Command and arrow keys work; on Windows and Linux, Ctrl and the arrow keys. Some decoders offer a rotate button instead, which is easier to find than you would expect.
Two more knobs matter. Sample rate affects the audio bandwidth the decoder expects; leave it at whatever matched your cable. And if the image comes out looking like a photographic negative, with clouds black and land white, flip the polarity setting. Listeners regularly get normal or inverted pictures from the same frequency, and the polarity toggle fixes it without any retuning.
5. Save and Label the Weather Chart
Set the output directory in the decoder’s configuration before the chart finishes, not after. In FLdigi the Wefax tab under Configure and then Modems holds the save path and the auto-save option. Turn auto-save on and every chart writes itself to disk as it completes, which matters when the image takes 20 minutes to arrive and you walk away from the desk.
Label files so you can still read them in six months. Station call sign, carrier frequency, date and UTC start time, and the chart type. A file called image-0412.png tells you nothing; NMG-17146-2026-10-04-1630-surface-analysis.png does.
Keep the transmission time with the image. Charts are valid only from the moment they were issued, and a surface analysis six hours old is worse than no chart at all because it looks current.
6. Read the Weather Chart
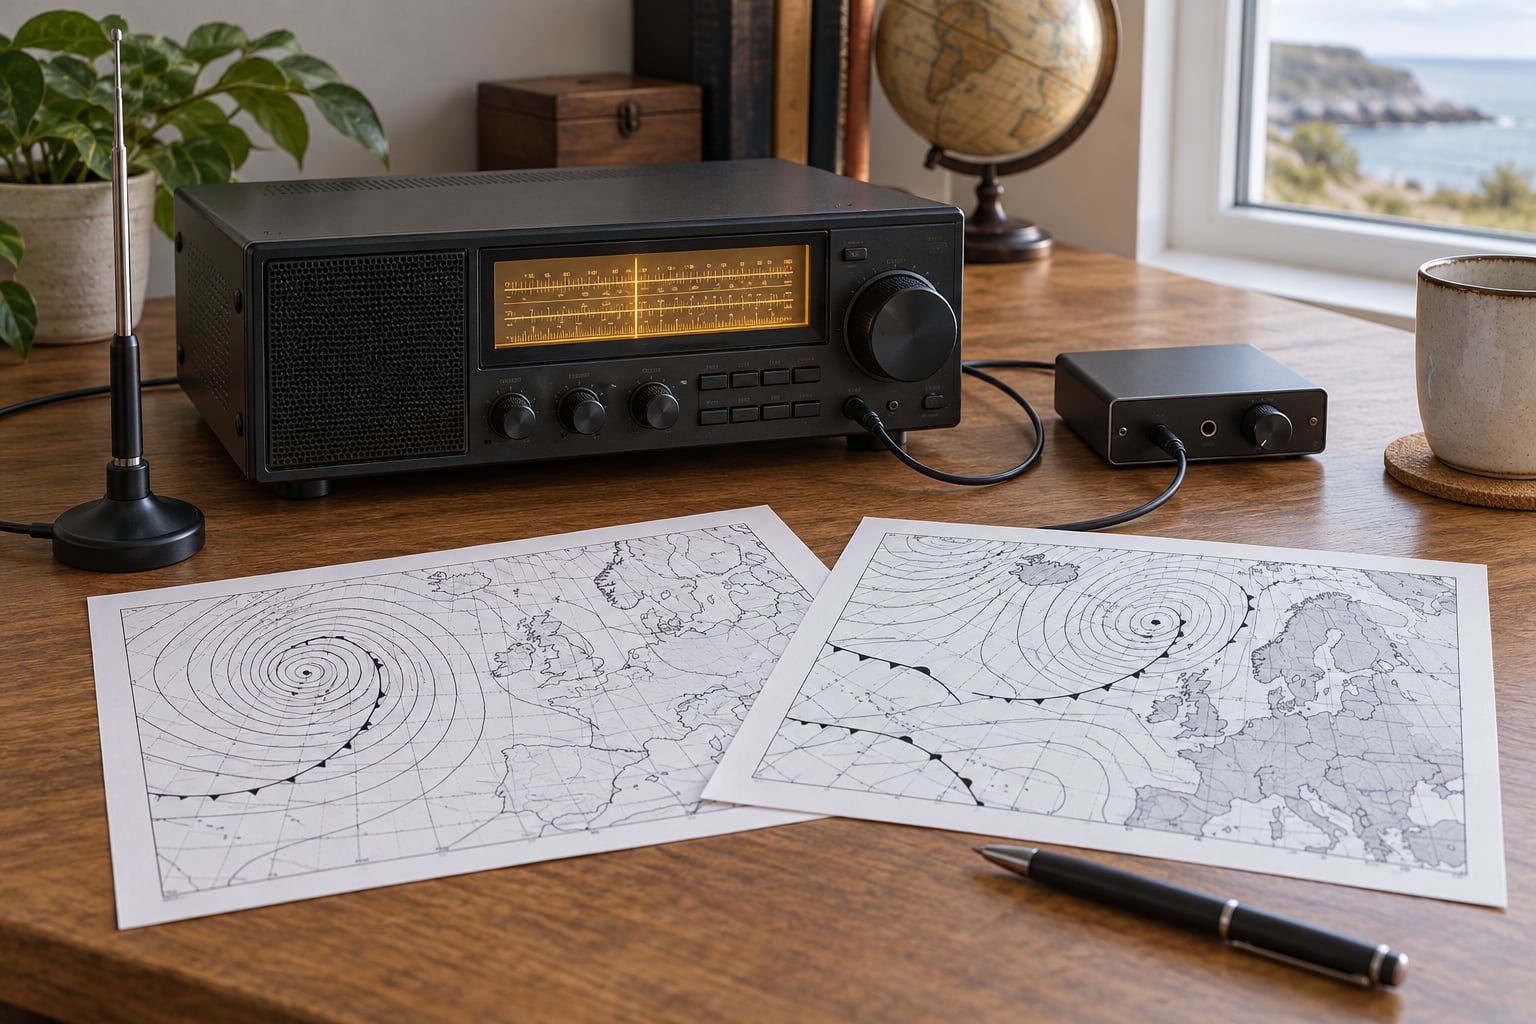
Most guides stop at the moment the picture appears, which leaves you holding an image you cannot interpret. A surface analysis chart is a map of observed conditions at one time. Curved lines are isobars joining points of equal air pressure, labelled in hectopascals. Tightly packed isobars mean strong wind; wide spacing means light air.
Pressure centres are marked with a letter. L means low pressure, which in the northern hemisphere brings counter-clockwise winds and unsettled weather. H means high pressure, clockwise winds and usually clearer skies. Numbers between them give the central pressure, and a rapidly deepening low is the chart version of a storm building offshore.
Fronts are lines with markers. A cold front has triangles pointing in the direction it is moving, a warm front has semicircles, and an occluded front has both alternating. The symbols sit on the side the front is heading toward.
Wind barbs are little arrows with feathers. The shaft points into the direction the wind is coming from, and each full feather adds roughly 10 knots. Isobars with no barbs at all mean light or calm conditions on that line.
Temperatures on a fax chart are written in whole degrees Celsius, cloud amounts in tenths, and visibility and wind speed in a coded shorthand on the station plot. Satellite imagery is a different product entirely — a photographic or infrared view of cloud cover, useful for tracking tropical systems long before a surface analysis draws them.
Common Mistakes
Almost every bad weather fax image is one of a handful of problems. Work down the table and fix them in order.
| What you see | Cause | Fix |
|---|---|---|
| Nothing decodes, decoder never locks | Tuned to the published carrier instead of 1.9 kHz low | Dial 1.9 kHz below the listed frequency in USB |
| Garbled lines, image breaks up mid-picture | Audio level too high, input overloading | Reduce receiver audio or decoder input gain |
| Whole image flat grey, no contrast | AGC or compression squashing the tone range | Turn off AGC and any noise reduction |
| Image leans into a parallelogram | Slant, from slight receiver frequency error | Adjust the slant control slowly until lines stack |
| Picture looks like a negative | Inverted polarity | Toggle the polarity setting in the decoder |
| Solid black or white blocks across the image | Electrical overload or transmitter keying during reception | Add ferrite chokes, move the antenna away from mains wiring |
| Fine tuning keeps sliding back | Automatic frequency control enabled | Switch AFC off in the decoder or radio |
| Clear tone but no picture | Wrong mode or wrong start time | Select WEFAX IOC-576, confirm the schedule in UTC |
| Audio works, decoder pane is flat | Wrong input device or sample rate mismatch | Reselect the input device and match the sample rate |
Two things sit outside the decoder. Propagation matters: the 6 MHz band and the 13 MHz band behave differently at night than in daylight, and the hour around dawn and dusk gives a genuine boost on long paths. Start with whichever band suits your local time rather than fighting a path that is working against you.
Local noise is the other one. Nearby AM broadcast transmitters can overload a cheap SDR’s front end before any weather signal gets a chance. A notch filter helps, an attenuator helps more, and simply moving the antenna away from a length of mains cable helps more than either. If the background hiss rises sharply when you touch the antenna, you have a ground loop or a poor common-mode rejection problem, not a propagation problem.
Frequently Asked Questions
Do I need a ham radio license to receive weather fax?
No. Receiving weather fax on shortwave is entirely legal without any amateur radio licence, in the United States or anywhere else. You are only listening, and listening needs no permission. Transmitting does require a licence, but you never need to transmit to decode a chart. Everything described here works on any HF-capable receiver, and no test or callsign is involved.
Why do I tune 1.9 kHz lower than the listed frequency?
Because the picture is carried as audio tones from about 1500 Hz to 2300 Hz above the carrier, not at the carrier itself. If you centre the radio’s receive filter on the carrier, those tones sit at the edge of the passband and get clipped. Tuning 1.9 kHz low puts the tone range in the centre of the filter, where the decoder can read it cleanly.
Why is my decoded weather fax image slanted?
Slant comes from a small error in your receive frequency, and the decoder compensates line by line so the error does not accumulate. Open the slant control in the decoder and tap the up and down arrows slowly until the vertical lines stack squarely and the image forms a rectangle instead of a parallelogram. Most decoders auto-align, but the final correction is still manual.
Is the weather fax still used?
Yes. NOAA and the National Weather Service transmit marine radiofacsimile charts on HF on a fixed schedule, as do the Deutscher Wetterdienst and the Japan Meteorological Agency. Offshore, crews use HF-FAX because it needs no internet and no satellite data allowance. For a shortwave listener it is one of the few scheduled HF picture services still on the air, and it works fine alongside marine RTTY, NAVTEX and time signals.
Can I decode weather fax on an iPhone or Android without a computer?
Yes, with mixed results. Apps such as HF Weather Fax for iOS run entirely on the phone and decode from the receiver’s speaker output with no cable, at the cost of some sensitivity. For a stronger signal, run an SDR app like SDRuno on Android and feed its audio into a decoder app. Both approaches work, but the phone microphone picks up room noise, so a cable into the headphone socket is more reliable.
How do I know whether a decoded chart is actually usable?
Check three things before you trust it. The image should be a straight rectangle with no slant and readable place names, which tells you the tuning and sync were correct. The chart should carry a date and time, and you should compare that against the broadcast schedule. And the content should match what you expected for that station. A garbled or slanted capture may still be a real chart, but not one to plan a passage from.
Conclusion
Start with three actions. Confirm a station and its broadcast time from the NOAA marine schedule page, then dial 1.9 kHz below the listed carrier in USB. Set up the audio path with AGC off and the level well clear of clipping. Let the decoder run in WEFAX IOC-576 mode and correct the slant as the image builds, then save each chart labelled with its station, frequency, UTC time and chart type.
Once the first chart lands, the whole thing is routine, and picking up a second station or moving to an SDR setup takes minutes rather than an afternoon.